Mastering Windows in Android Studio: 5 Practical Steps for a Bold and Remarkable App Development Experience

WINDOWS IN ANDROID STUDIO
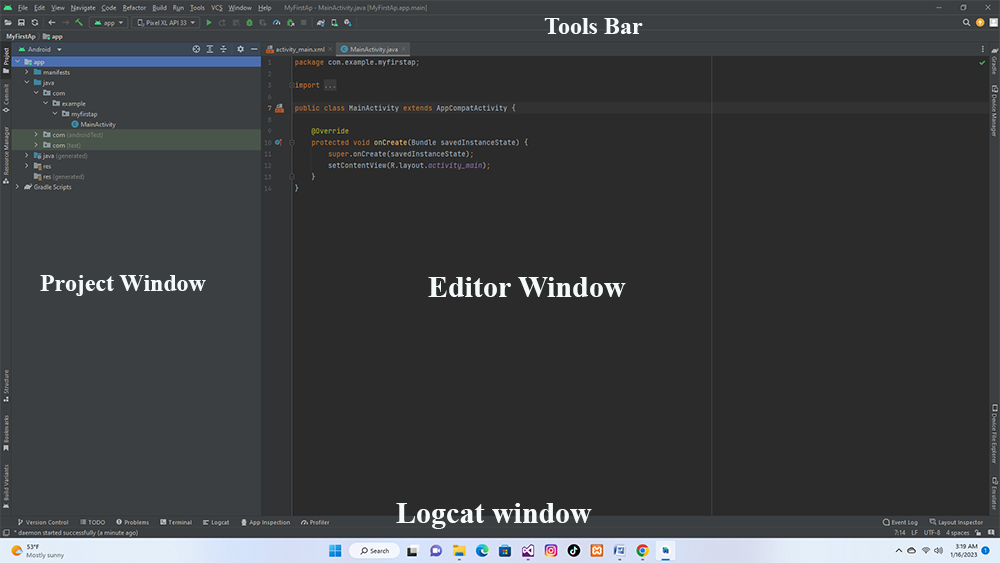
Android Studio is the official Integrated Development Environment (IDE) for developing Android apps. It includes various windows and tools for building, testing, and debugging Android apps. Some of the main windows in Android Studio include:
- The “Project” window: This window displays the file structure of the app, including the source code, resources, and manifest file.
- The “Editor” window: This window is where developers write and edit code. It includes features such as code completion, syntax highlighting, and error checking.
- The “Design” window: This window provides a visual layout of the app’s user interface,

allowing developers to drag and drop UI elements and preview their layout on different screen sizes and orientations. - The “Logcat” window: This window displays log messages generated by the app, which can be useful for debugging.
- The “Terminal” window: This window allows Developers to interact with the command line while they are working on the project.
- The “Android Profiler” window: This window allows the developer to monitor the performance of the app in real time, it can help to identify performance bottlenecks, memory leaks, and more.
These are some of the main windows in Android Studio, there are other windows and tools available for specific tasks such as debugging, testing, and deploying apps.
TOOL BAR IN ANDROID STUDIO
The main toolbar in Android Studio is located at the top of the window and provides quick access to commonly used tools and actions. It is divided into several sections, each of which contains a set of related buttons and menus.
The first section of the toolbar is the “Run” menu, which contains options for running and debugging your app. The “Run” button will launch the app on an emulator or connected device, while the “Debug” button will launch the app in debug mode, allowing you to step through the code and inspect variables. The “Profile” button will launch the app in profiling mode, which provides detailed information about the app’s performance and memory usage.
The next section is the “Build” menu, which contains options for building and deploying your app. The “Build” button will compile the code and generate an APK (Android Package) file that can be installed on a device or published to the Google Play Store. The “Clean” button will remove any temporary files and rebuild the project from scratch. The “Rebuild” button will rebuild the project, including all the dependencies.
The third section is the “Version Control” menu, which provides access to version control tools such as Git and SVN. This menu allows you to commit changes, push and pull from remote repositories, and view the history of your code.
The fourth section is the “Refactor” menu, which contains options for refactoring your code. Refactoring is the process of restructuring your code without changing its functionality. This menu allows you to rename variables and methods, move code between files, and extract code into a separate method or class.
The fifth section is the “Navigate” menu, which provides options for navigating through your code. This menu allows you to quickly jump to a specific class, method, or file, and also allows you to search for specific text within your code.
The sixth section is the “Tools” menu, which contains options for various tools such as the Android Device Monitor, the Layout Editor, and the Lint code analysis tool. The Android Device Monitor allows you to view the file system, process, and network status of a connected device. The Layout Editor provides a visual layout of the app’s user interface, allowing developers to drag and drop UI elements and preview their layout on different screen sizes and orientations. Lint is a code analysis tool that checks your code for potential bugs and performance issues.
The seventh section is the “VCS” menu, which contains options for version control systems such as Git and SVN. This menu allows you to commit changes, push and pull from remote repositories, and view the history of your code.
The last section is the “Help” menu, which contains options for getting help with Android Studio and the Android SDK. This menu includes links to the Android Studio documentation, the Android developer website, and the Android issue tracker.
the main toolbar in Android Studio provides quick access to the most commonly used tools and actions, while the additional tool windows provide more advanced functionality.
PROJECT WINDOW IN ANDROID STUDIO
The “Project” window in Android Studio is a tree-like structure that displays the file structure of the app, including the source code, resources, and manifest file.
 It is located on the left side of the main window and can be opened and closed by clicking on the “Project” button in the toolbar or by using the shortcut key “Alt + 1”.
The top level of the project window represents the root of the project and displays the app’s package name. Underneath the root level, there are several subfolders that contain the different components of the app.
The “app” folder contains the main source code for the app, including the Java and Kotlin files. The “res” folder contains the resources for the app such as layouts, images, and strings. The “manifest” file contains the app’s configuration settings, such as the app’s package name, required permissions, and activities.
The “Gradle Scripts” folder contains the build configuration files for the app, such as the “build.gradle” file. The “build” folder contains the output of the build process, including the APK file that can be installed on a device or published to the Google Play Store.
The project window also allows you to easily navigate to specific files within the project, you can also perform actions such as renaming and deleting files and folders, and also you can also access the context menu which offers more options like creating new files and folders, import and export projects.
The “Project” window in Android Studio provides a clear and organized view of the app’s file structure, making it easy for developers to navigate through the project, access and manage the different components of the app, and perform various actions such as renaming and deleting files and folders. It is a powerful tool for managing the project structure and resources, and it is a must-use window for any developer working with Android Studio.
EDITOR WINDOW IN ANDROID STUDIO
The “Editor” window in Android Studio is where developers write and edit code. It is the main window where developers spend most of their time working on the project. The editor window can be opened by double-clicking on a file in the project window or by using the shortcut key “Alt + 2”.
The editor window includes several features to help developers write and edit code more efficiently.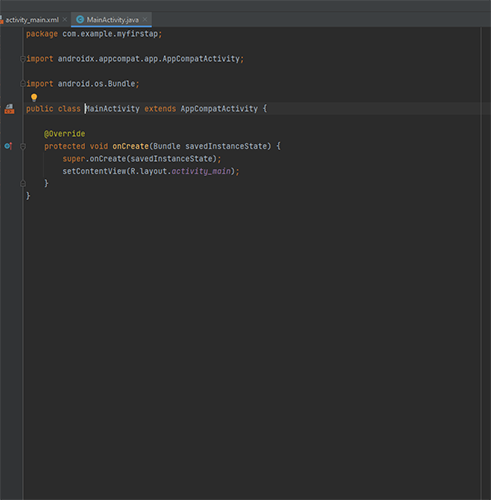
Some of these features include:
- Code completion: As you type, the editor will provide suggestions for variable and method names, as well as for keywords and other code constructs. This helps to reduce the amount of typing required and also helps to prevent mistakes.
- Syntax highlighting: The editor will highlight different parts of the code, such as keywords, variables, and strings, in different colors. This makes it easier to quickly identify and understand the different parts of the code.
- Error checking: The editor will automatically check the code for errors, such as syntax errors and undefined variables, and will highlight them in the code. This makes it easy to quickly identify and fix errors.
- Code folding: The editor allows you to collapse and expand sections of code, making it easier to navigate and focus on specific parts of the code.
- Code formatting: The editor allows you to automatically format the code to follow a specific style, such as the Android code style, and also allows you to customize the formatting.
- Code navigation: The editor allows you to quickly navigate through the code, such as jumping to a specific class, method, or file, and also allows you to search for specific text within the code.
The editor window also allows you to perform several actions such as copy, paste, undo and redo, and also provides a convenient way to comment and uncomment code.for writing and editing code. It includes several features such as code completion, syntax highlighting, error checking, and code navigation that help to make the development process more efficient and less prone to errors. An editor window is an essential tool for any developer working with Android Studio and it allows you to perform various actions with the code and navigate through the project.
LOGCAT WINDOW IN ANDROID STUDIO
The “Logcat” window in Android Studio is a tool that displays log messages generated by the app.
The “Editor” window in Android Studio is the main window
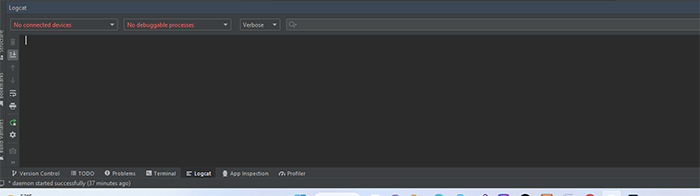
It can be used to monitor the app’s behavior, identify errors, and troubleshoot issues. The Logcat window can be opened by clicking on the “Logcat” button in the toolbar or by using the shortcut key “Alt + 6”.
Logcat displays log messages in a scrolling text view, with the most recent messages at the bottom. Each log message includes the following information:
- Tag: A short string that identifies the source of the log message, such as the class or method name.
- Priority: The priority level of the log message, such as “Error”, “Warning”, “Info”, “Debug”, etc.
- Time: The timestamp of when the log message was generated.
- PID: The process ID of the app that generated the log message.
- Message: The text of the log message.
You can filter the log messages displayed in the Logcat window by tag, priority, and message text. This allows you to focus on specific log messages that are relevant to your debugging task. Additionally, the Logcat window allows you to clear the log, save the log to a file, and also allows you to jump to the source code location where the log message was generated.
Logcat is a powerful tool for debugging and troubleshooting, it can help you to understand how the app behaves, identify performance bottlenecks, and also detect errors and crashes. It is essential for any developer working with Android Studio to use the logcat window to identify and solve problems.
The “Logcat” window in Android Studio is a powerful tool for debugging and troubleshooting. It displays log messages generated by the app and allows you to filter the log messages by tag, priority, and message text. It can help developers to understand how the app behaves, identify performance bottlenecks, detect errors and crashes, and is an essential tool for any developer working with Android Studio.
PROFILER WINDOW IN ANDROID STUDIO
The “Android Profiler” window in Android Studio is a tool that allows developers to monitor the performance of an app in real time.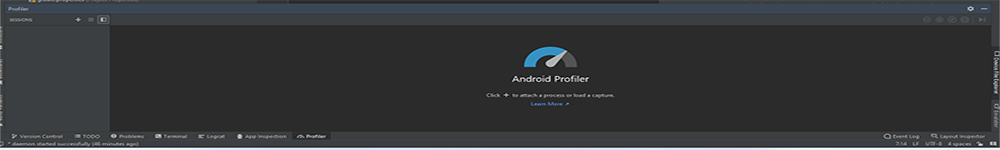
It provides detailed information about the app’s CPU, memory, network, and energy usage. The Android Profiler can be opened by clicking on the “Android Profiler” button in the toolbar or by using the shortcut key “Alt + 8”.
The Android Profiler window includes several panels that provide different types of performance information. Some of these panels include:
- CPU: This panel shows the CPU usage of the app, including the percentage of time spent in user code and system code. It also shows the number of threads and the number of active cores.
- Memory: This panel shows the memory usage of the app, including the heap size and the number of allocated objects. It also shows the number of garbage collection events and the time spent in garbage collection.
- Network: This panel shows the network usage of the app, including the number of bytes sent and received, and the number of connections.
- Energy: This panel shows the energy usage of the app, including the battery level, the amount of power being consumed, and the estimated time remaining on the battery.
The Android Profiler allows you to take memory heap dump, capture network traffic and also allows you to record method traces to analyze performance issues. It also allows you to filter and record performance data based on specific scenarios, this allows you to analyze performance issues in specific scenarios and track performance over time.
The Android Profiler is a powerful tool for identifying performance bottlenecks, memory leaks, and other issues that can affect the app’s performance. It is essential for any developer working with Android Studio to use the Android Profiler to ensure that the app is performing well and identify and solve any performance issues.
The “Android Profiler” window in Android Studio is a powerful tool for monitoring the performance of an app in real-time. It provides detailed information about the app’s CPU, memory, network, and energy usage, and also allows you to take memory heap dump, capture network traffic, and record method traces. It is an essential tool for identifying performance bottlenecks, memory leaks, and other issues that can affect the app’s performance and any developer working with Android Studio should use it.
Related Links
Conclusion
In the context of Android Studio, the Windows operating system serves as a crucial environment for software development. Its compatibility with Android Studio allows developers to harness the full potential of the integrated development environment (IDE) and build Android applications efficiently. Windows provides a familiar platform that caters to a wide range of users, making it a popular choice among developers working on Android projects.
With Windows as the operating system, developers can take advantage of the comprehensive set of tools offered by Android Studio to design, code, test, and debug their applications. The seamless integration of Android Studio with the Windows environment facilitates a smooth development workflow, enabling developers to focus on crafting high-quality apps without unnecessary hindrances. Windows-based systems also provide ample support for the deployment of Android applications to various devices, allowing developers to reach a diverse audience.
In conclusion, Windows plays a vital role in the Android Studio ecosystem by providing a robust foundation for developers to create, optimize, and manage Android applications. Its compatibility with Android Studio empowers developers to streamline their development process and contribute to the ever-expanding landscape of Android apps.
Q: 1. What role does the operating system play in Android Studio development?
A: The operating system serves as the foundation for Android Studio, providing the environment in which developers create, test, and debug Android applications. It impacts the compatibility, performance, and overall development experience within the IDE.
Q: 2. Is Windows a suitable choice for Android app development in Android Studio?
A: Yes, Windows is a widely used operating system for Android app development in Android Studio. Its compatibility and support for the tools and features offered by the IDE make it a popular choice among developers.
Q: 3. How does the integration of Android Studio with Windows benefit developers?
A: The integration of Android Studio with Windows offers a seamless development experience. It enables developers to leverage the full capabilities of the IDE, streamline their workflows, and create high-quality Android applications efficiently.
Q: 4. What advantages does the Windows environment bring to Android development?
A: The Windows environment provides developers with a familiar platform that supports a range of development tools. It offers a conducive environment for coding, testing, and deploying Android apps, contributing to a productive and user-friendly development process.
Q: 5. Can I deploy Android applications developed on Windows to other operating systems?
A: Yes, Android applications developed on Windows using Android Studio can be deployed to a variety of operating systems, including Android, as long as the app is designed and tested to be compatible with the target platform. Android Studio provides the necessary tools to manage cross-platform development considerations.
More Linsk
